transitstacks
Transit Stacks
Basic tools for downloading and viewing the Cal-ITP transit technology stack database.
Installation
From source:
pip install .
Usage examples
Browse Components in all Transit Stacks
import transitstacks as ts
all_stacks = ts.Stack(
ts.read_stack_from_gsheets(filter_dict = {"Transit Provider": "GET Bus"})
)
# list all products
my_stack.components_df.products
# get most common products
my_stack.components_df['products'].value_counts().sort_values(ascending=False)
You can use the Jupyter Notebook /notebooks/Stack Database Analysis.ipynb for interactive viewing of dataframes by using the
command jupyter notebook.
Browse relationships in Single Transit Stack
import transitstacks as ts
my_stack = ts.Stack(
    ts.read_stack_from_gsheets(filter_dict = {"Transit Provider": "GET Bus"})
    )

my_stack.relationships_df
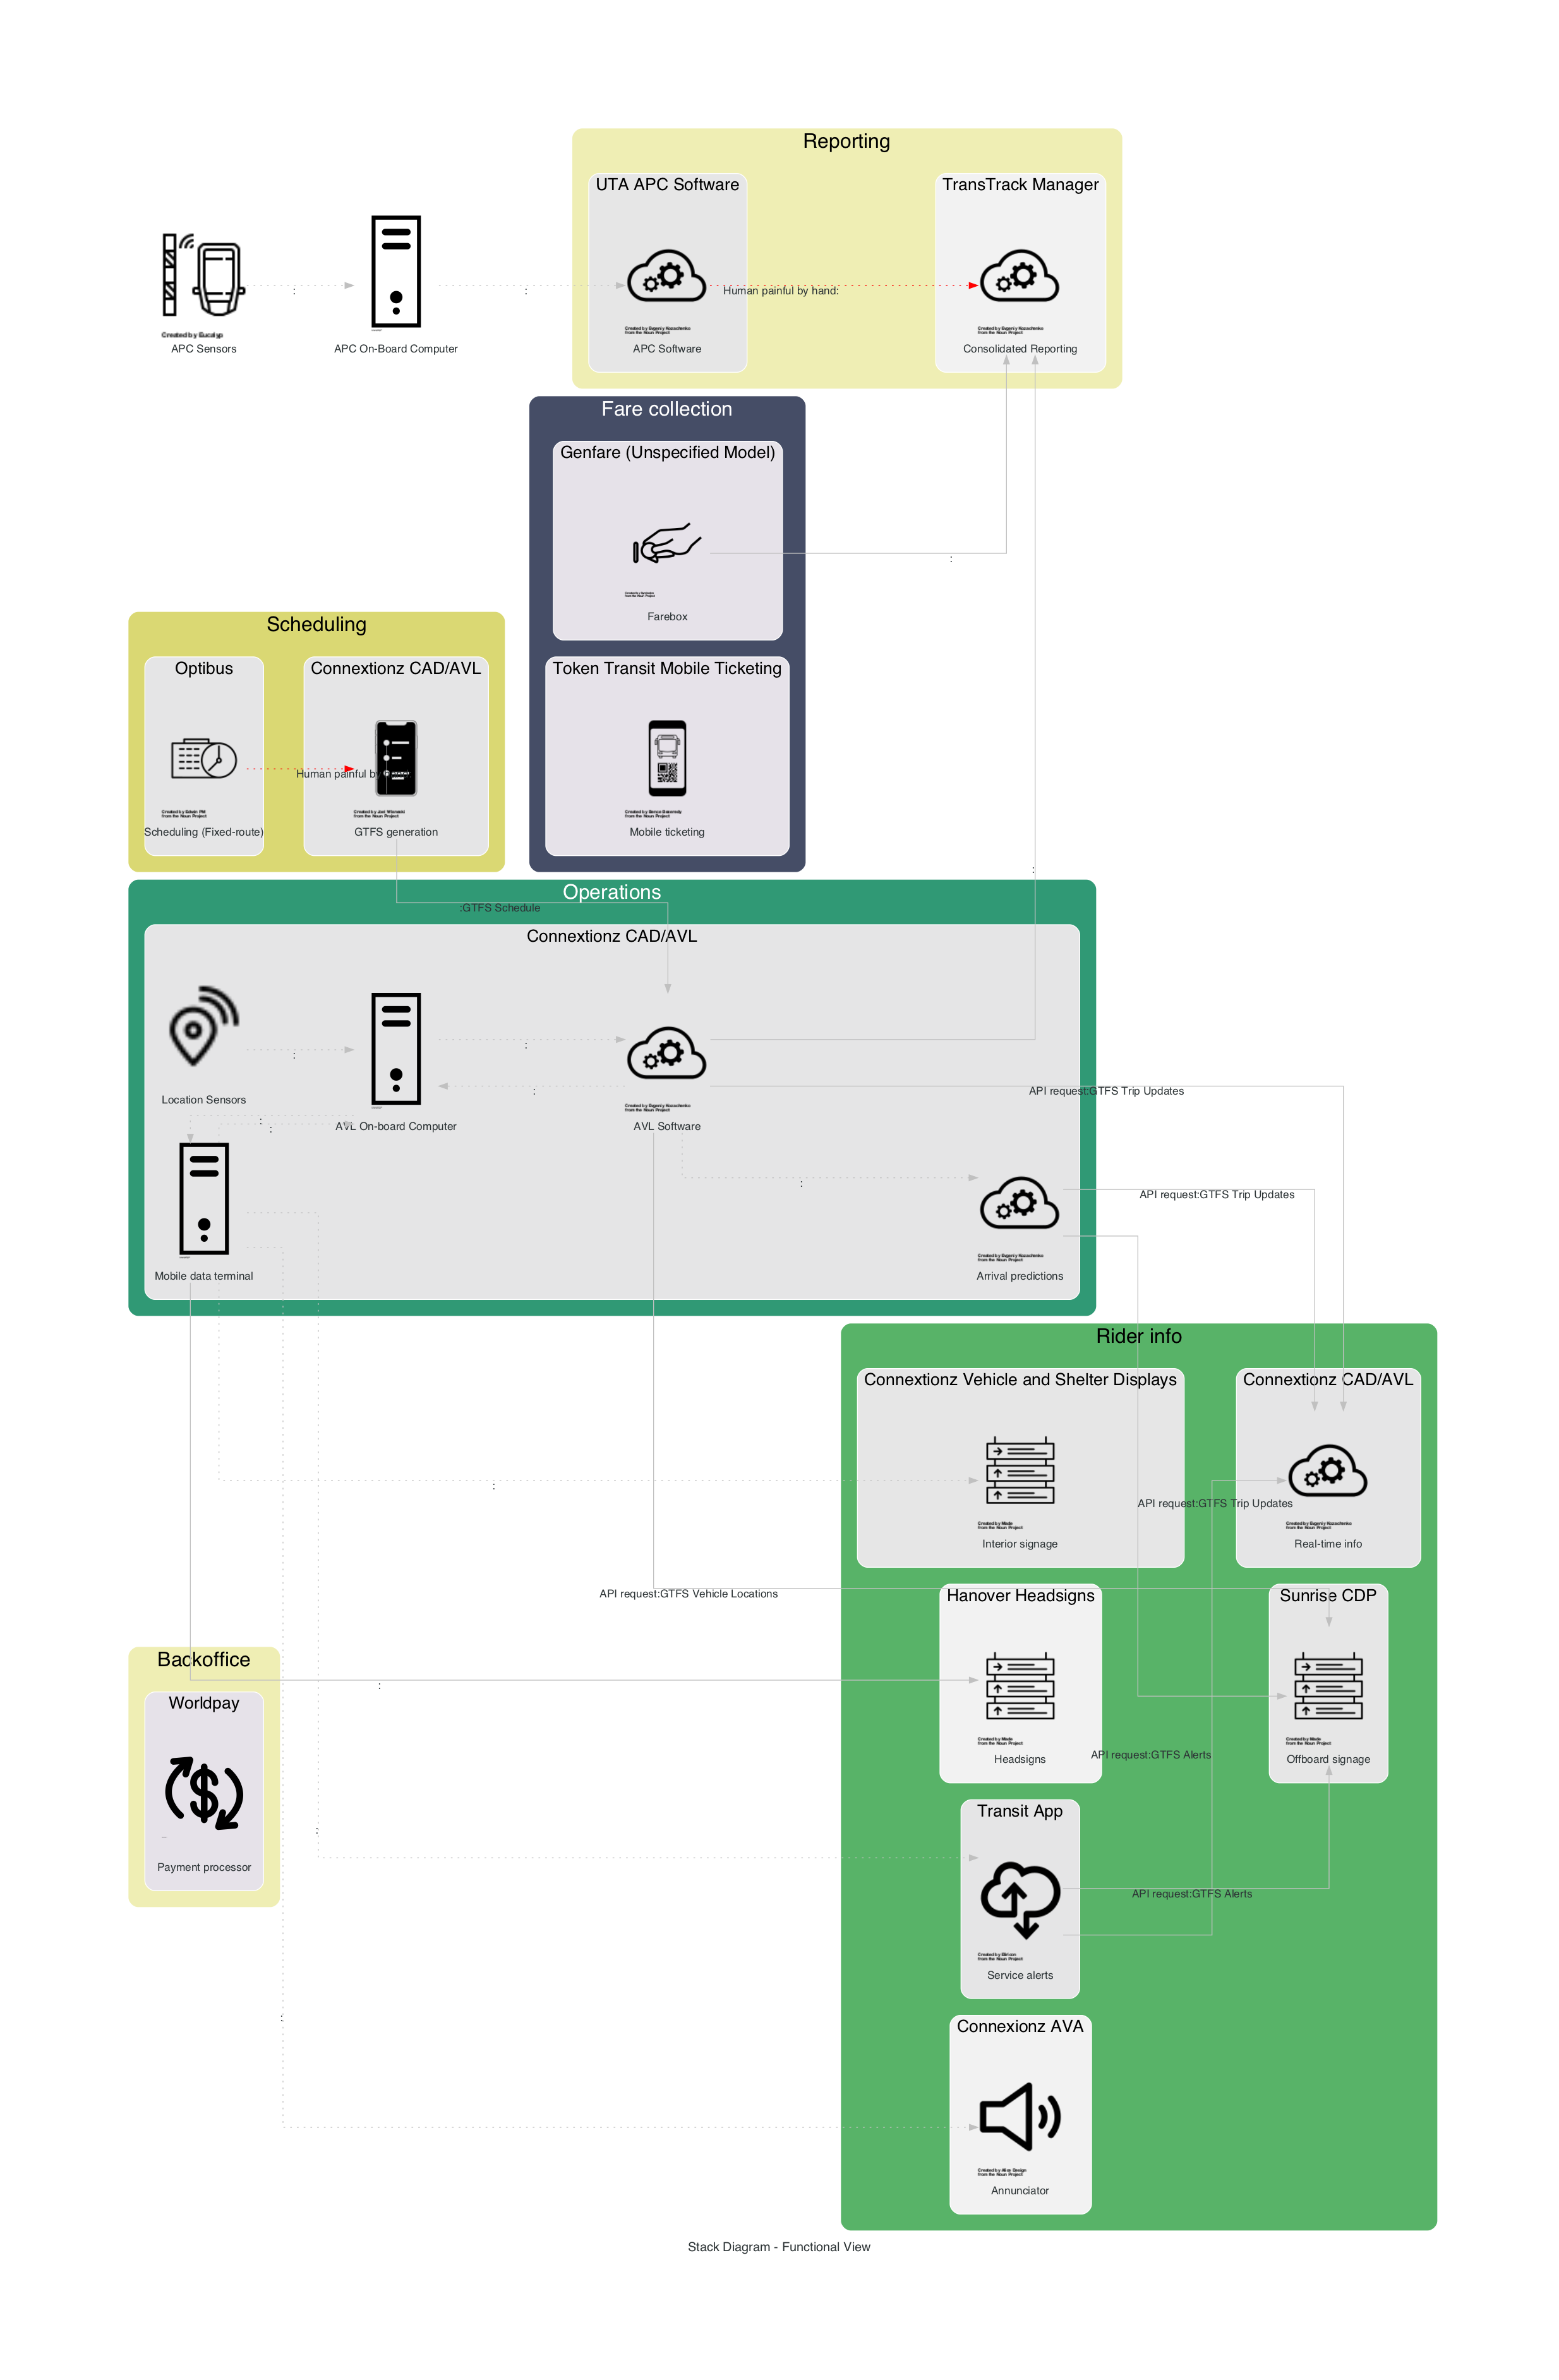
Create a transit stack diagram with two grouping levels
LEVEL1 = "Function Group"
LEVEL2 = "Product"

d = ts.stack_diagram(
    my_stack,
    cluster_level_1 = LEVEL1,
    cluster_level_2 = LEVEL2,
    bgcolor_cluster_L1 = ts.stack.greenyellow_functiongroup_map,
)
You can use the Jupyter Notebook /notebooks/Individual Transit Provider Analysis.ipynb for interactive transit stack diagram
generation by using the command jupyter notebook.
Contributing
General steps:
- Fork it (https://github.com/e-lo/Transitstacks/fork)
- Create your feature branch (
git checkout -b feature/fooBar) - Add your feature, add tests which test your feature, document your feature, and pass all tests.
- Commit your changes (
git commit -am 'Add some fooBar') - Push to the branch (
git push origin feature/fooBar) - Create a new Pull Request
Development requirements are listed in dev-requirements.txt and can be installed by:
pip install -r dev-requirements.txt
Tests are written for pytest and can be run using the command pytest.
Docstrings are written in google style and
auto-rendered as api documentation using mkdocstrings as specified in /docs/api.md.
Documentation uses mkdocs and is in the /docs folder.
It can be rendered locally using the command mkdocs serve.
Licenses
- Code is offered as AGPL 3.0 and developed on behalf of the California Integrated Travel Project.
- Data is offered as CC BY-NC-SA 4.0 and developed on behalf of the California Integrated Travel Project.